Activist Rate Comparisons Ignore Infrastructure Investments - Truth from the Tap

TFTT Report

Activist Rate Comparisons Ignore Infrastructure Investments

Activists routinely praise utilities with low rates, but there are important reasons why low rates should not be seen as a badge of honor. The experience in Visalia, California, is a good illustration why.

The water system in Visalia, California, has been owned and operated by California Water Service (Cal Water) since 1926.[i] To try to justify attempts to force a government takeover of the Cal Water system in Visalia, condemnation advocates touted a Regional Water Rate Analysis, which they said showed that Visalia residents were paying too much for water service compared to neighboring systems.[ii]

But, just like other activist rate comparison reports, this regional rate analysis failed to tell the full story: Cal Water invests more in improvements to its water system in Visalia than nearby government-owned utilities do, a key context that rate comparisons ignore.


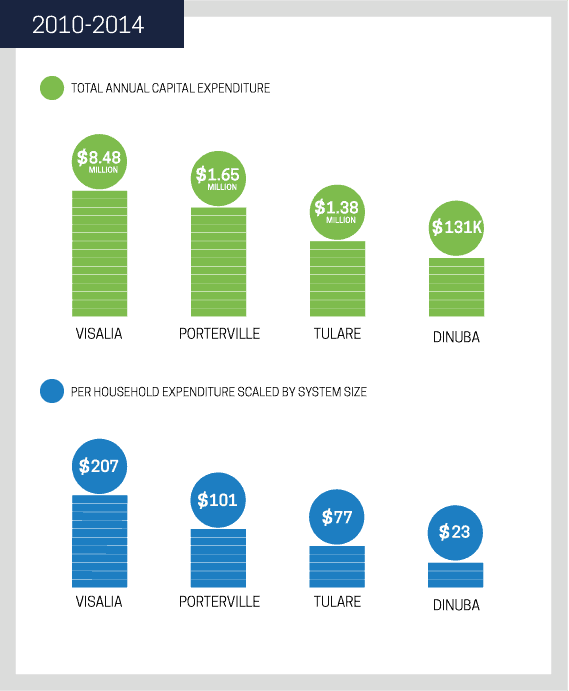
From 2010 through 2014, Cal Water completed an average of $8.48 million in annual capital expenditures to improve the water system in Visalia.[iii] By comparison, the nearby city of Porterville spent an average of $1.65 million per year on capital expenditures for its water system, while the nearby city of Tulare spent just $1.38 million per year.[iv] The city of Dinuba spent even less, averaging just $131,000 per year.[v]

Even if these investments are scaled by the size of the system, Cal Water spent far more on improvements per household served: $207 per household in Visalia compared to $101 per household in Porterville, $77 per household in Tulare and $23 per household in Dinuba.[vi]

These system investments ensure safe drinking water, cut down on service disruptions, and enable adequate water pressure in the event of a fire or other emergency.[vii] If Porterville, Tulare, Dinuba, and other nearby government-owned utilities made the same level of investments in their water systems as Cal Water, their customers would be paying far more for water service.

Evidence, once again, that rate comparisons that ignore infrastructure investments are bogus and should be disregarded. Visalia residents were astute enough to understand that a government takeover would have resulted in a bad deal for the city. After a public opinion survey showed Visalia voters opposed to a government takeover of the water system by a margin of more than 3 to 1, city officials dropped the condemnation effort.[viii]


[i] California Water Service, “About Cal Water – Visalia”
[ii] City of Visalia, “Citywide Update,” as presented to the Visalia Economic Development Corporation on 18 November 2015; California Water Service, “Fact-Checking The City of Visalia’s Regional Water Rate Analysis”
[iii] Capital Expenditures are estimated by calculating the average cash outflows on capital investments reported in public documents. Line items for Visalia include: Additions on the Analysis of Utility Plant Schedule (excluding Undistributed Items); Construction Work-in-Progress listed on the End of Year Balances. Note: Capital Expenditures associated with the conversion of flat to meter have been excluded, as this is considered a one-time expenditure related to a public policy objective distinct from continued investment in water system infrastructure and maintenance.
[iv] Capital Expenditures are estimated by calculating the average cash outflows on capital investments reported in public documents. Line items for Porterville include: Construction and Other Capital Projects and Purchase of Capital Assets.
[v] Capital Expenditures are estimated by calculating the average cash outflows on capital investments reported in public documents. Line items for Dinuba include: Purchases of Capital Assets.
[vi] Capital Expenditures are estimated by calculating the average cash outflows on capital investments reported in public documents. Line items for Visalia include: Additions on the Analysis of Utility Plant Schedule (excluding Undistributed Items); Construction Work-in-Progress listed on the End of Year Balances. Note: Capital Expenditures associated with the conversion of flat to meter have been excluded, as this is considered a one-time expenditure related to a public policy objective distinct from continued investment in water system infrastructure and maintenance. Line items for Porterville include: Construction and Other Capital Projects and Purchase of Capital Assets. Line items for Dinuba include: Purchases of Capital Assets. The total Capital Expenditures for each city was divided by the number of households.
[vii] California Water Service, “About Cal Water – Visalia” and California Water Service, “What a City Government Takeover of the Water System Would Mean for You and Your Family”
[viii] The Business Journal, “Visalia backs down from Cal Water takeover” January 7, 2016.
Return to TFTT Report →