Why Rate Comparisons Fall Short
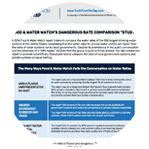
A 2016 Food & Water Watch report claims to compare the water rates of the 500 largest drinking water systems in the United States, concluding that the water rates for private water utilities are higher than the rates of water systems run by local governments.1 Despite its prominence in the public conversation and the stickiness of a “58% higher” statistic that the group is quick to throw around, the rate comparison report is severely scientifically flawed and fails to compare the rates of local government systems and private systems on equal footing. Further, they fail to note that, even if that 58% figure is accurate, that would equate to paying 50 cents more a day for water – an amount well worth it if it means having water that is safe to drink and not having to pay a much higher price for bottled water at the grocery store.
The Many Ways Food & Water Watch Fails the Conversation on Water Rates

USES A FLAWED, UNREPRESENTATIVE DATASET
The report uses an unrepresentative dataset that tries to draw conclusions about all water systems by analyzing only the largest 1% of systems in the U.S.
The report uses an unbalanced dataset that heavily favors government systems (442 systems included in the study) vs private systems (58 systems included in the study). In no way does the group attempt to compare equal sets of government and private systems that have similar characteristics.

IGNORES GOVERNMENT SUBSIDIES AND TAXES
The report fails to account for non-rate revenues that act as subsidies for government systems and make cost comparisons to private systems inequitable.
The report fails to account for state and local taxes paid by customers of private systems. Government system customers do not pay such taxes.

DOES NOT FACTOR IN CAPITAL INVESTMENTS
The report fails to account for differences in capital investments between systems, blindly praising low-cost systems without considering impacts on key elements of service provision like water quality and infrastructure reliability.
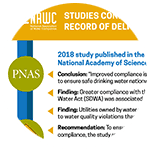
The Food & Water Watch ideology on rates is flawed and dangerous. The group blindly celebrates low-cost government systems and completely ignores EPA data showing that such systems are far more likely to deliver unsafe water that violates federal drinking water standards.2 Narratives around customer costs, especially when comparing the water bills of government systems and private systems, must be crafted with care and attention to detail. Flawed back-of-the-napkin style reports like the one produced by Food & Water Watch cannot be trusted to tell the full story on water rates.
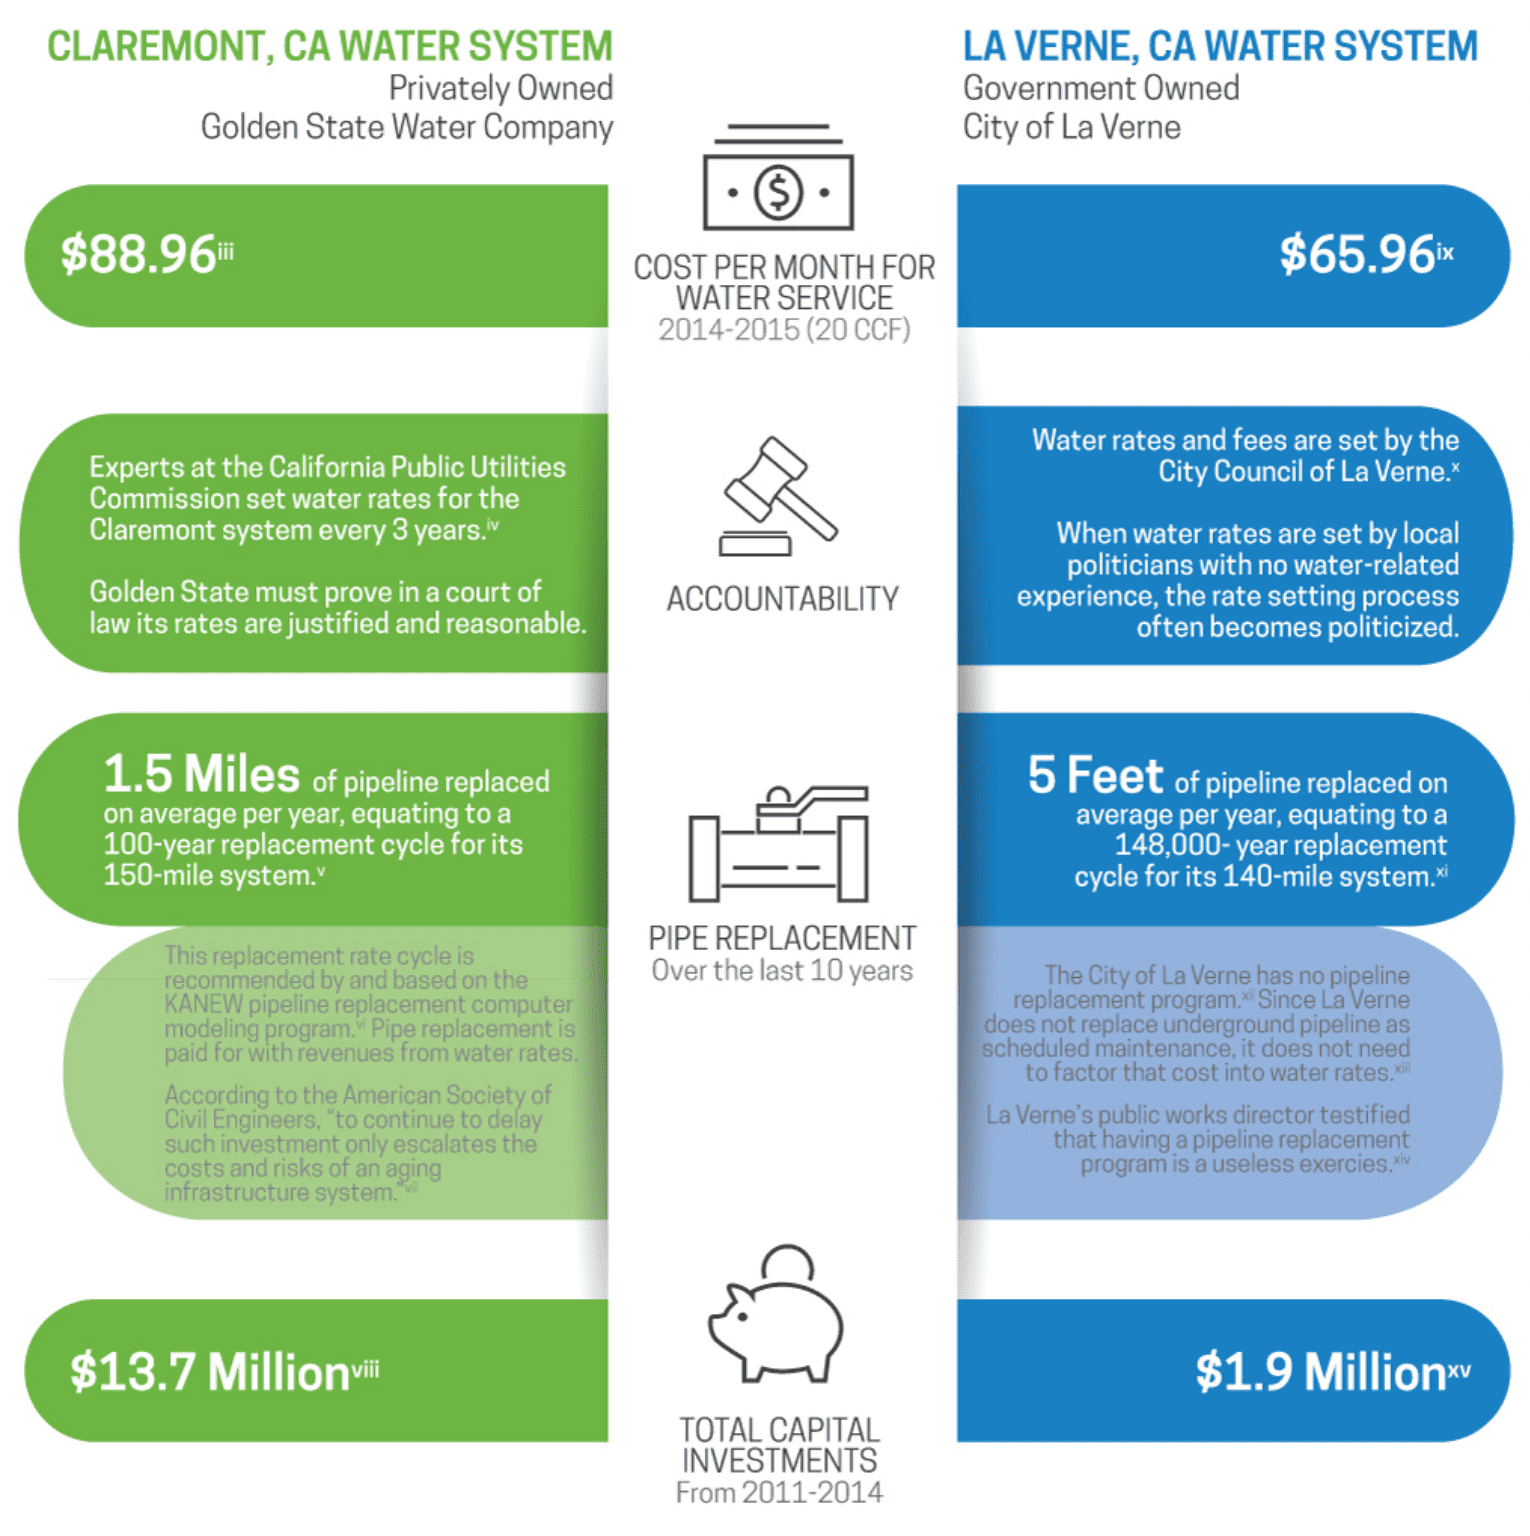
An example from California shows how oversimplified, fictitious rate narratives don’t tell the full story. Experts repeatedly warn that comparing the rates of different water systems with different investment practices is misleading and unwise. The chart below shows why. While Claremont’s monthly rate is slightly higher than La Verne’s, Golden State Water invested 600% more in water infrastructure than the City of La Verne between 2011 and 2014.
Infrastructure investments matter. While Claremont has a perfect water quality record, La Verne has had three health-based violations of the Safe Drinking Water Act, including a boil water episode due to E. Coli contamination.
Toolkit
Sources:
1. Food & Water Watch, “The State of Public Water in the United States” February 20162. Allaire, Wu and Lall, “National Trends in Drinking Water Quality Violations” in the Proceedings of the National Academy of Sciences, February 2018 (link); Konisky and Teodoro, “When Governments Regulate Governments” November 2014 (link); American Water Intelligence, “Investor-Owned Water Firms Boast Sterling SDWA Record” October 2011

